
Dashboard Technical Documentation
General Information
Confidence Intervals
A confidence interval is a range around a measurement that conveys how precise the measurement is. Ninety-five percent confidence intervals are provided for the age-adjusted rates in these dashboards. These are analogous to the margins of error that are provided for news polls.
In the simplest terms, an age-adjusted death rate of 124.5 cases per 100,000 with a confidence interval of 122.5 - 126.6 cases per 100,000 means that there is a 95 percent chance that the rate was between 122.5 and 126.6 cases per 100,000. Conversely, there is a 5 percent chance that the rate was lower than 122.5 or higher than 126.6.
The precise statistical definition of the 95 percent confidence interval is that if the measurement were conducted 100 times, 95 times the true value would be within the calculated confidence interval and 5 times the true value would be either higher or lower than the range of the confidence interval.
Death rates are subject to what is termed “random error”, which arises from random fluctuations in the number of cases over time or between different communities. The 95 percent confidence intervals are an easily understood way to convey the stability of the rates. A stable rate is one that would be close to the same value if the measurement were repeated, i.e., if the rate did not vary greatly from one year to the next. An unstable rate is one that would vary from one year to the next due to chance alone. Wider confidence intervals in relation to the rate itself indicate instability.
Narrow confidence intervals in relation to the rate tell you that the rate is relatively stable, and you would not expect to see large fluctuations from year to year. If differences are observed between stable rates (those with narrow confidence intervals), then it is likely that the differences represent true variations, rather than random fluctuations in the number of cases.
Race/Ethnicity
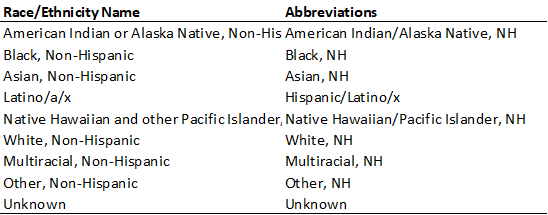
Race/Ethnicity is presented as one combined variable with mutually exclusive values, in hierarchical order with the following logic:
If a person is listed as “Latino” or “Hispanic” in the original data source, they are shown as “Hispanic/Latino/x” regardless of other designation of rate unless explicitly specified.
For all other persons, if they are listed in the original data source with more than one racial group, they are shown as “Multiracial”.
All other persons are shown as a single race.
The following labeling is used for these race/ethnic categories:
Drug Overdose Dashboard
Drug Overdose Deaths
Drug overdose death data (numerators) for Mendocino County residents were obtained from the California Department of Public Health California Comprehensive Death File. County of death was based on decedents’ state and county of residence. Drug overdose deaths include unintentional, intentional, and undetermined causes of death. Death rates are age-adjusted to the 2000 US standard population. International Classification for Disease – 10th Revision (ICD-10) codes for each of the causes of overdose death are listed below:
Cause of death: International Classification of Disease (ICD) - 10th Revision
Drug overdose*: X40-X44, X60-X64, X85, Y10-Y14
Opioid overdose**: T40.0-T40.4, T40.6
Stimulants with abuse potential**: T43.621A, T43.622A, T43.623A, T43.624A
*Underlying cause of death
**Underlying and multiple cause of death
Emergency Department (ED) Visits for Drug Overdose
Data on emergency room visits are collected through the National Syndromic Surveillance Program (NSSP), and the data is accessed through the NSSP BioSense Platform. All hospitals in Mendocino County with an emergency department submit data to NSSP/BioSense. For more information about NSSP and the BioSense platform, please see the “About NSSP” page here: https://www.cdc.gov/nssp/ \php/about/index.html. ED visits include all patients who entered care for drug overdose through the emergency room. Due to nature and importance of data timeliness, ED visits have been aggregated into quarters, and all case numbers are presented. The following classifications were used for ED visits and include:
All drug overdose, opioid overdose, fentanyl overdose, benzodiazepine overdose, methamphetamine overdose if they met the criteria in the following respective definitions: CDC All Drug Overdose Parsed v3, All Opioid Overdose Parsed v4, Fentanyl Overdose Parsed v2, Benzodiazepine Overdose Parsed v2, Methamphetamine Overdose Parsed v1.
Hospitalizations for Drug Overdose
Data on hospitalizations are collected through the National Syndromic Surveillance Program (NSSP), and the data is accessed through the NSSP BioSense Platform. All hospitals in Mendocino County with an emergency department submit data to NSSP/BioSense. For more information about NSSP and the BioSense platform, please see the “About NSSP” page here: https://www.cdc.gov/nssp/ \php/about/index.html. Hospitalizations include all patients who were hospitalized for drug overdose, regardless of where they were admitted. Due to nature and importance of data timeliness, hospitalizations have been aggregated into quarter, and all case numbers are presented. The following classifications were used for hospitalizations and include:
All drug overdose and opioid overdose if they met the criteria in the following respective definitions: CDC All Drug Overdose Parsed v3, All Opioid Overdose Parsed v4.
MCAH Dashboard
Birth Characteristics
Birth data were obtained from the California Department of Public Health California Comprehensive Birth file for Mendocino County residents. County of birth was based on the individuals’ giving birth state and county of residence. Birth data for California were obtained from CDC Wonder.
Vital records data are self-reported and occasionally incomplete. Unknown data have been removed from both the numerators and denominators in these cases to more accurately reflect the relative proportion of each category.
Leading Causes of Death
Death data (numerators) for Mendocino County residents were obtained from the California Department of Public Health California Comprehensive Death File. County of death was based on decedents’ state and county of residence. Death data for California were obtained from CDC Wonder. As of August 2026, Mendocino County death data do not include deaths to residents that occurred out of state. The leading causes of death were determined based on underlying cause of death ICD-10 codes using the National Center for Health Statistics classifications for the 15 leading causes.
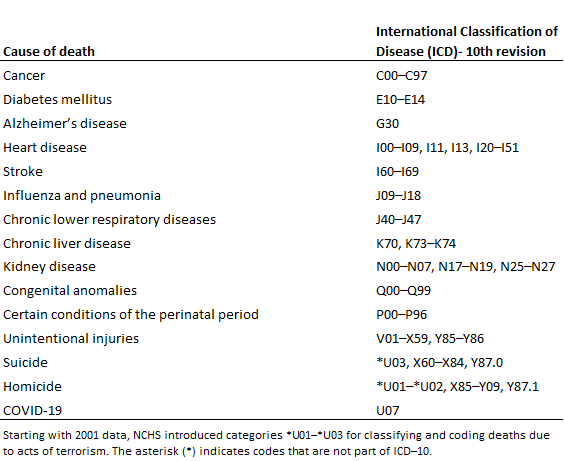
Death Rank: Rank is determined by the number of deaths for each cause.
Death Rate: Rates are age-adjusted to the 2000 U.S. Standard population. Denominators for Mendocino County data are from California Department of Finance, P3 File. Age-adjusted rates for California data are from CDC Wonder.
Premature Death Rank: Rank is determined by the number of Years of Life Lost before age 75 for each leading cause of death. Years of life lost (YLL) is a measure of premature mortality (early death) calculated by subtracting the age at death from the standard year, then summing the individual YPLL across each cause of death. Calculation of YLL is based on summing for all deaths, the number of years prior to age 75 that each death occurs, with 0 YLL used for deaths occurring at ages >= 75.
Premature Death Rate: Rates are age-adjusted to the 2000 U.S. Standard population. Denominators for Mendocino County data are from California Department of Finance, P3 File. Age-adjusted rates for California data are from CDC WISQARS (data available through 2022). Calculation of YLL rate is based on summing for all deaths, the number of years prior to age 75 that each death occurs, with 0 YLL used for deaths occurring at ages >= 75. Rates are age-adjusted per 100,000 population.
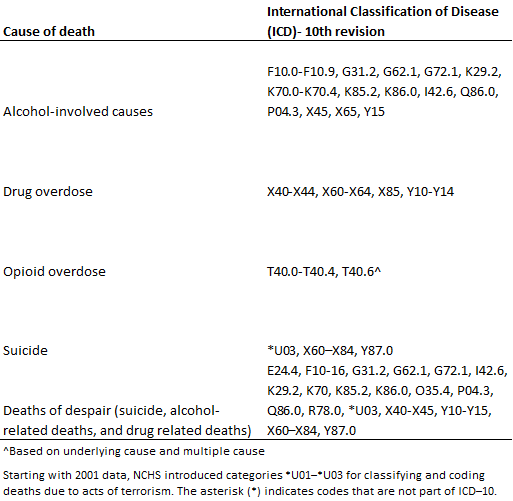
Rates are age-adjusted to the 2000 U.S. Standard population. Denominators for Mendocino County are from California Department of Finance, P3 File. Age-adjusted rates for California data are from CDC Wonder (data available through 2021).